Ubidots
Low-code application development for the Internet of Things
Introducing the Custom UI Widget
We’re excited about our latest addition to Ubidots Advanced Widgets: the Custom UI - the Swiss-army knife of all widgets. It allows you to mix UI components at will, in order to build your own interface using:
- Text labels
- Numeric inputs
- Text inputs
- Date inputs
- Buttons
- … And more in the future!
Once configured, you can trigger a webhook to an UbiFunction or 3rd-party platform to process the input data — or just go to another Ubidots dashboard or an external link.
Custom UI's (historically made by hand, using our HTML canvas widget) have been at the center of many of your IoT applications. Here a few examples:
- A truck driver who inputs data in a smartphone about incidents along the route. This data enriches the GPS data already collected in Ubidots.
- A machine expert who just finished a maintenance task and leaves the maintenance date with comments in a tablet located next to the machine.
- An IoT-fleet operator who sets configuration parameters and triggers a downlink function when hitting “Send”.
Connect your Ambient Weather stations with Ubidots
Ambient Weather offers one of the most comprehensive and affordable product suites for weather monitoring. Their popular weather stations aren't only equipped with various weather sensors, but also act as a gateway for external indoor and outdoor sensors, such as soil moisture, pollution, or even pool monitoring sensors.
With our new Ambient Weather plugin you can easily bring the data of these devices into your Ubidots account with just a few clicks.
Using OAuth 2.0 as the Authorization Protocol of your external Application
You can give end users access to your Ubidots devices and variables through your external apps (whether they’re web, desktop, or mobile-based) in a controlled and safe way by using our OAuth 2.0 endpoints.
OAuth 2.0 is an authorization protocol designed with the aim of granting limited access to a set of resources within a web service (Ubidots in this case). With this protocol, end users are given access for 1 hour and it can be refreshed whenever you want.
Integrate Intercom and Ubidots to have in-app customer support
Intercom is a popular customer communications platform that lets you better understand who is using your product or website and, through a comprehensive toolkit, allows you to improve the connection with your users with targeted content, behavior-driven messages, and conversational support.
One of their hallmark tools are their powerful and intuitive live chats for customer support. If you're already an Intercom user, you'll be happy to know that you can now have one of these chats in your Ubidots App by integrating these platforms (Ubidots and Intercom) with the help of Google Tag Manager.
New Feature: Custom Invitation Email
The process of inviting end users to your app ends with the optional step of sending emails to them. We’ve added a new feature that allows you to create a custom email template to save time in the invitation process.
Until now, if you wanted to edit and customize the message, it had to be done every time you wanted to invite someone, which could become redundant for organizations that have to go through this process frequently. Now, however, you can create a template that will be used as the default message every time you invite new people.
The Custom Invitation Email feature is available for Professional plans and above.
Create a Customer Support Chat in Your App With HubSpot
HubSpot, a powerful platform that houses all the marketing tools imaginable, can be integrated into Ubidots to boost the capabilities of your IoT app. This can result in, for instance, a much more direct and powerful impact on your customers or final users in the way of support.
That's not a minor thing when you consider that dealing with customers is a craft in and of itself, and as such, requires appropriate tools before anything is even done. And that's precisely one of the most outstanding things that can be achieved with this HubSpot integration, the fact that you can have your very own customer support channel within your Ubidots app, thus increasing your outreach and the quality of your service.
This integration is available for Enterprise plans and above.
Add new rows to values tables
Being one of our oldest and most popular widgets, the Values Table deserved some love. However, we didn’t want the change to be just aesthetic, but also functional. That’s why other than encountering a widget that’s on par with the design changes we’ve been progressively introducing to the platform, you’ll also get to use a Values Table that allows you to edit and introduce values at will.
This change, in addition to all the features you already loved about the Values Table, increases the control and possibilities you have over your operation. Whether it’s to keep track of the output of a machine or to store any data that has to be logged manually, the new Values Table will be your favorite tool.
New Feature: Dashboard Filters
Expand your visualization possibilities by applying filters to your dashboard based on variables’ values or context. With filters, your map widget can display only the devices whose latest data was above certain value, or make your metric-type widgets (Bar chart, Battery, Gauge, Indicator, Metric, Tank, Temperature and Variables table) show its last or aggregated values after filtering its data. Filters are now available to all Industrial plan users and above.
Boost Your Dashboards and Widgets
As part of your customization capabilities within Ubidots, it’s now possible to add background images to both your dashboards and widgets, allowing you to easily highlight specific widgets, add your brand’s touch, or just to enhance their appearance.
New Plugin: NCD FFT
Prior to IoT, a Maintenance Manager had to call a machine diagnosis expert to determine whether an axis was unbalanced, or a bearing was about to fail. Similar to having a nurse coming to your house to take samples, experts would connect accelerometers to a machine, record the response, and then come back later with a diagnosis. As good as this results were, the process had the following issues:
- It had to be done on-site, no remote option
- It was expensive
With tools like NCD's Wireless Vibration Sensor V3, Ubidots' monitoring tools, and our new Fast Fourier Transform plugin, doing condition monitoring and predictive maintenance for your machines is faster, cheaper, and more convenient than ever.
With the NCD FFT plugin you’ll be able to obtain the Fast Fourier transform of raw acceleration captured through the NCD sensor. With your data now in the frequency domain, you can use our Frequency Chart widget to plot it and enable applications such as vibration analysis for machine health diagnosis.
This plugin is available to all Industrial plans (or higher).
Learn more here.
New Widget: SCADA
Industries like water management, manufacturing, or energy have relied on SCADA systems for decades to improve efficiency and control operations. If you’ve worked in industries like these or with equipment like PLCs, chances are you’ve come across the famous SCADA visualizations.
Mixing industry standards with our flexibility and ease of use, it’s now possible to have those visualizations in Ubidots thanks to our new SCADA widget! With it, you’ll be able to create them without purchasing expensive software or spending hundreds of valuable hours coding.
Using an editor entirely devoted to this widget, you’ll be able to design schematics that work and look like the famous SCADA systems visualizations, which use standard engineering symbology and with which it’s possible to intuitable arrange an entire operation into one comprehensive image.
The SCADA widget is available to Industrial plans and above. If your plan is below Industrial, but would like to try this widget, let us know.
New Widget: The Frequency Chart
Our catalog of widgets keeps growing with this month’s introduction of the Frequency Chart widget. This widget enables tasks such as vibration analysis for machinery diagnosis by allowing you to plot data frames at high sampling rates more efficiently.
Let’s say we have an electrocardiogram (ECG) application that is taking samples at a rate of 60 Hz. Plotting these data in a line chart, for example, would have required streaming 60 dots per second, which is well above our API rate limits. Instead, you can now store 1 dot per second and 60 readings inside the context of that dot, and then use the Frequency Chart widget.
This widget is available to Industrial plan holders and above.
Our Reports Got Better
Our reporting module allows you to take snapshots of widgets to include them in the PDF or Excel file you want to generate. It’s a good way to bolster your reports by making them even more graphic and, thus, easier to understand.
We've heard you! We improved the snapshot tool by increasing how customizable it is. On one hand, you can pick the widgets of any device in a dynamic dashboard. On the other, the size of the widget in the report can now be changed so that it ends up looking just like you need it.
New Widget: The Heatmap Table
No one wants to feel the heat, but what about seeing it? We are introducing a new widget that lets you do just that: the Heatmap Table. Select a variable and a color logic and you’ll have a convenient overview of weeks or months’ worth of data. It allows you to simplify complex data into visualizations that can be easily understood and identified.
Few things are as eloquent as seeing a bunch of blue, calming squares and, in between them, an alerting, solitary red square sticking out like a sore thumb. Regardless of the industry (such as oil and gas as prime examples), it immediately provides you with all the information you need — something is wrong and must be fixed. We hope nothing like this happens to you, but if it does, better have a Heatmap at hand! This widget is available to all Industrial and Enterprise plan holders.
Our Latest Cloud Functions Additions
Ubidots Cloud Functions (or UbiFunctions) is a serverless computing environment for the IoT, enabling you to run on-demand custom functions directly from Ubidots. Although originally designed as a custom decoding tool, it has grown into an integration and analytics powerhouse. Our latest additions to it include:
-Securely access your token from the function's code (avoiding copy-pasting API tokens in the code).
-User-defined time outs.
Introducing Map Zones
Our map widget keeps improving! In the previous newsletter we shared how it was now possible to display a dashboard over it, and today we’re introducing yet another function: the ability to plot a zone on the map, and associate it with a Device Group.
A zone is a defined area within the map that visually encloses the devices in a marker group. Zones act as a second layer that sits on top of the map and can be of a fixed color or color-react based on either a fixed variable value or a zone metric. They can compute metrics across variables in the marker group’s devices or even act upon actions such as click or double click — giving you not only visual feedback about your fleet, but also allowing you to interact with the widget.
If You Like Your Dashboard, Put a Ring on It
New Widget: The Ring Gauge
Our catalog of available widgets has just gotten bigger with the addition of a new ring gauge that’s all about convenience: it gives you the opportunity to display the current value of up to four different variables. As for its settings, you can independently define the aggregation method and color logic for each variable.
This widget is particularly useful for variables that are related, as would be the case, for example, of a solar energy solution where 4 key variables would be monitored: energy generated, the charge of the batteries, the electric current, and the overall consumption.
Timestamp in Manual Input
Hypothetical case: A production plant needs to log production values at the end of the shift with a specific, manually chosen timestamp. Previously, the timestamp was automatically generated when the data was logged, but it’s now possible to do it manually.
New Map Action: Display Dashboard
You can now set up a map action that allows you to load a dashboard on top of the map as a pop-up. With just one or two clicks, you’ll be able to access all the relevant information of your dashboard without having to switch between tabs or click away.
One Dashboard to Rule them All
Share the same Dashboard with multiple Organizations
Organizations allow for total independence of each deployment, enabling you to share devices, groups, events, and dashboards to specific customers. By design, each one of these entities could only belong to a single Organization.
With the introduction of Dynamic Dashboards, it became useful to reuse the same dashboard design not only across multiple devices, but also across multiple clients.
It is now possible for a dashboard to belong to multiple Organizations.
Imagine you have 100 clients, each with 100 devices, for a total of 10,000 devices. Given the amount of devices per client, it makes sense to use a Dynamic Dashboard instead of creating one per device. However, creating the same Dashboard 100 times, one for each Org, would be quite time-consuming. Instead, create a single Dynamic Dashboard, and share it with 100 Organizations.
Spreading the reporting love
Reports for End Users
Ubidots Reports allow you to create detailed and customized documents with the data you need over a specific time frame, and in different file formats (XLS/PDF) — plus, its mailing can be programmed and automated.
Until now, reports could only be created and managed by the Admin of the Ubidots account, but it's now possible to grant End Users permission to see, create, edit or delete them.
This is especially useful to avoid long iterations between you and your customers while fine-tuning a report. This feature is now available to all Industrial plan holders and above.
Password recovery for end users
We’re introducing the Password Recovery option for end users to improve efficiency and comfort. Previously, if an end user lost access to their account, the only way to retrieve it was by contacting the admin of the Ubidots License. Now, they will be able to request it directly from in the app portal.
One Smart Cookie
Cookie compliance integration with Google Tag Manager
Google Tag Manager (GTM) is a free tag management system that facilitates the deployment and management of digital marketing tags — tracking pixels used, among other things, for web analytics, audience measurement, heatmap tracking, and GDPR (General Data Protection Regulation) compliance.
You can now use GTM in your Ubidots app. Our original motivation? Give you an easy way to incorporate Cookie Consent Managers into your end-user apps, adding a layer of formality that can make a good impress.
Letting users know and decide what personal information is stored in the form of cookies is not only considered best practice, but also mandatory depending on local regulations.
Compute Moving Averages and other Rolling Operations
In case you missed it, a few months back, our CEO held a webinar about doing Predictive Maintenance without having to become a data scientist. In it, he explained the simplest (yet viable) form of anomaly detection: comparing a variable against its moving average.
Prior to this feature, rolling operations were limited to date ranges (for example: an hourly average). Thanks to your feedback, it is now possible to compute rolling operations based on an amount of values (for example: an average every 3 values).
Scale your data - not just your deployment
Often, variables need to be modified, whether it's because a sensor is not properly calibrated or because you need to shift from one measurement unit to another.
Even though it was already possible to do this by creating a Synthetic Variable (a popular feature of our platform), at times it ended up being an overkill for small adjustments such as offsets or scaling.
This could be the case when, for instance, a user who had 1,000 temperature variables in °F wanted to change them to °C: 1,000 additional synthetic variables had to be created, raising the overage costs and storage.
With Scaling Function, simply add an offset and a slope to any of your variables, and your data will be automatically adjusted upon reception.
New feature announcements
? Introducing announcements
We're thrilled to announce a new way to share our latest features, right here on our platform, so you don't miss any option to make your experience with Ubidots much better.
Stay tuned for future updates!
📝 Discover our all-new reporting engine
During the past few quarters, our Analytics team has been busy re-writing our entire reporting module from scratch, and today we're pleased to announce it:
We took all of the "Scheduled Reporting" features you already knew, and baked them into our "Data Explorer" module. The result? A new interface to build and preview more powerful reports for you and your clients.
You can now find the new reporting tool under "Data" --> "Analytics" --> "Reports", along with any Scheduled Report you had previously created:
Key features
- A new interface to schedule the automated XLS/PDF reports you already love.
- Live preview: Build your report at one click, just as it will be rendered and sent to your clients.
- Rich date-picker: A new UI with simpler date navigation, including "Start date + Span", "From -> To", or any of our existing quick date ranges.
- New sections: Add custom titles and paragraphs, and more section types to come.
- Save multiple Reports: Previously called "Experiments", every Data Explorer analysis was only saved in the local storage of your browser, which meant you could only keep one "Experiment" per session. Now, you can save them as "Reports" for future analysis.
🖱 Adding actions to our values table widget
If I had to create minimal viable product (MVP) for an IoT application, I would build a simple table to log sensor data and display it in a sheet-style format. Well, it is no coincidence that our Values Table Widget has become an essential building block of your IoT applications, ranking #2 in our list of most created widgets. This year alone, you folks created 19,447 table widgets!
As one of your favorites, we decided to give it some love by adding actions so you can decide how a column behaves when clicking, or double clicking on it.
🌩 Trigger Particle downlinks as Ubidots Event actions
Particle Cloud allows devices to expose custom functions through their Cloud so they can be triggered externally using an API call. With a Particle.function line, a specific code on the device can be run when requested from the cloud API.
You typically do this when you want to control something on your device, say a LCD display or a buzzer, or control features in your firmware from the cloud.
Now, together with Ubidots’ Events engine and Particle functions, it is possible to run code on demand based on complex variable’s conditions or in a time weekly basis, in your Devices
See a full example, from Particle device to Ubidots cloud, on how to use this feature here.
🔟 Trigger UbiFunctions from Ubidots Events
Set up and trigger UbiFunctions using Ubidots' Events Engine.
UbiFunctions, Ubidots FaaS (Functions as a Service) module allows users to create their own HTTP API endpoints to perform actions or add functionalities that might fall outside Ubidots built-in features, and need to be tailored to each user application.
As custom user-built endpoints, UbiFunctions can be called via an HTTP webhook to execute any given logic but now, with native UbiFunctions Action in the Events Engine, doing so in a data-driven fashion will be easier than ever with the Event engine.
To learn more about UbiFunctions and actions, check out these articles:
⏱ Scheduled events: Trigger events at a given time
Be it for agritech, building management, or industrial applications, you can now create multiple schedules in a single Event, such as turning OFF an HVAC system on Friday at 6 PM, and then switch it back ON on Monday at 9 AM.
Just hover on the + icon in the Events module, and click on the new scheduled event icon:
Learn more about Scheduled Events here.
♒️ Monitor almost any US river in just a few clicks
Add streamflow data from the U.S. Geological Survey (USGS) to your IoT application in just a few clicks
WaterWatch is a U.S. Geological Survey (USGS) service with current water streamflow conditions in the United States.
This Plugin retrieves current real-time streamflow conditions from a specified site number. We've seamlessly integrated with WaterWatch web service so you don't have to, enabling you to use Ubidots to log streamflow data in just a few clicks:
See this article to learn how to monitor almost any US water stream in just a few clicks!
📚 Official launch of Ubidots STEM
Ubidots STEM is the evolution of "Ubidots for Education" (app.ubidots.com), which is not maintained anymore, and will be shut down on January 31st 2021. If you still have an Ubidots for Education account, we strongly encourage you to move your IoT project to Ubidots STEM.
STEM Limits
As a free product, Ubidots STEM has limited features and capacity:
Use
Limited to non-commercial use ONLY (personal education, IoT research, or DIY projects)
Capacity
- Devices: Up to 10 devices. First 3 devices free, then $4.5 / device / month
- Variables: Up to 10 variables per device.
- Data Ingestion: 4,000 dots per day across all of your devices
- Data Extraction: 500,000 dots per day across all of your account (UPDATE: This was originally 50,000, but we increased it following your feedback)
- Data Rate: 1 request per second, across all of your devices
- Data Retention: 1 month
- Dashboards: Up to 3 dashboards, with up to 10 widgets each
- SMS & Voice calls: 10 SMS and 1 Voice call for free per month (US & Canada only), then standard rates apply
- Emails: 100 Emails for free per month, then standard rates apply
- Uptime: No SLA - shared server resources across all STEM users. The speed and reliability is based on total platform requests at any given second.
- Support: Community-based, or self-service using our Help Center and API Docs
Features
- Static and Dynamic Dashboards
- HTTP, MQTT, TCP and UDP protocols
- SMS, Voice call, Email, WebHook, and Slack Alerts. Telegram messages are not supported.
NOTE: Because Telegram limits the amount of outbound messages per minute, this feature is reserved for our business users only, which allows us to better monitor and preserve the quality of service.
- Synthetic variables computation (math functions only - data range and advanced functions are not supported).
If you are an educational institution, or non-profit, please note that many of your fellow organizations choose to upgrade to Ubidots commercial licenses seeking one or many of the following:
- Longer data retention
- Enable a white-labeled portal for students or researchers to access private accounts
- Ability to run advanced Synthetic Variables
- Reliability and/or Support
Thank you to all of our users who, in one way or another, helped shape what Ubidots Education became, and what now Ubidots STEM is. We can't wait to see what you build!
📲 Adding a custom To" field to all Event Actions"
Prior to this feature, it was only possible to customize the "To" field in the Voice call event action, so we replicated this to all other actions.
This is useful because it allows use cases like:
- Use device_label dynamically within a Webhook's URL, which is helpful to send downlinks in many platforms, such as Particle Cloud.
- Use a phone number stored in a device property or "context" field, to send a Telegram or SMS.
- Use an email stored in a device property or "context" field, to send an Email.
To learn more about supported custom fields, see this article.
🖥 White-labeled Emails, and a brand-new look for Apps management
Branded apps are just great. With just a few clicks, you can start selling something that has taken us years to build - all under your own brand.
Not only have we improved the overall UX/UI of this key module; we've also added:
- Multiple custom "From" emails - one per app
- Hide selected features for end users: Still don't want to announce that new widget we just launched? - No problem, now you can hide some features from end users, giving you more control over your app.
- Further localization: Set number formats and decimal places per app.
- Two logos for branding: One for the app's header, another one for the login screen ... and more!
Check below a few guides on how to make the best of the new App's management experience.
- Customize your Ubidots user interface
- White-label emails coming from your application
- How to change your App's general and locale settings
- How to change your App's domain
In case you noticed, we're using a new type font and overall UI design, which will be gradually applied to other modules of the Ubidots platform.
🏬 Manage Organizations as an End User
Allow your end customers to manage Ubidots organizations as well.
? Organization Management as an End User
A couple of months ago we announced the ability for end users to create and manage other end users on their own. Today, we have taken this a step further by allowing you to expose Organization Management to your customers.
Why would I need this? Let's see an example
Joe has been providing manufacturing clients in his region with monitoring solutions for their power plants. His customers love how they can access a branded portal, and use real-time dashboards to anticipate failures and ensure continuous power delivery in their factories.
One day, Joe is approached by a leading power plant manufacturer, "Electric Power Inc." (EP Inc.), who wants to embed his solution as a default feature in their power plants. This can catapult Joe's business from hundreds to thousands of connected power plants — and with it a 100x revenue increase! Instead of asking Electric Power Inc. to open an Ubidots account, Joe creates a new white-labeled App inside his existing Ubidots account, enables the Organization management feature, and charges a recurring fee for the entire solution (Hardware+Cloud).
Under this model, Joe continues to serve EP Inc. as his direct
customer, while also allowing EP to manage Organizations, Devices,
Dashboards, Events and End users for their end customers.
Organization management is now available to all Industrial and Scale plan customers. If you're on a different plan and would still like to try this out, please let us know.
✨ Announcing Ubidots plugins
Ubidots Plugins: The simplest way to connect apps and services to the Internet of Things
IoT is mostly about using sensors and actuators to merge the physical with the digital, transforming processes, companies, or even entire industries! However, a vast amount of physical data already resides in the digital domain, be it in the form of APIs, public datasets, or just a spreadsheet in your computer.
This month, we're proud to announce Ubidots Plugins, a new way of connecting apps and services to the Internet of Things. After seeing how creative our own customers could get when coding their UbiFunctions, be it to track live energy prices, solar irradiance, or weather data, we decided to build a new module to easily integrate with external data sources and services.
What is a Plugin?
A Plugin is an extension of Ubidots' feature set, which is provided by either one of our partners, or the Ubidots team itself.
Plugins come in different flavors, depending on how they reflect in your Ubidots account. Currently, only Data Plugins are supported:
- Data Plugins: These plugins ingest data from external services, and store it in an Ubidots device.
Other types to be enabled in the future are:
- Dashboard Plugins: These plugins specify new types of Widgets that can be added to your dashboards.
- Event Plugins: These plugins specify new types of Event actions, which become available to use within our Events engine module.
Available plugins
Presently, the following Data Plugins are available:
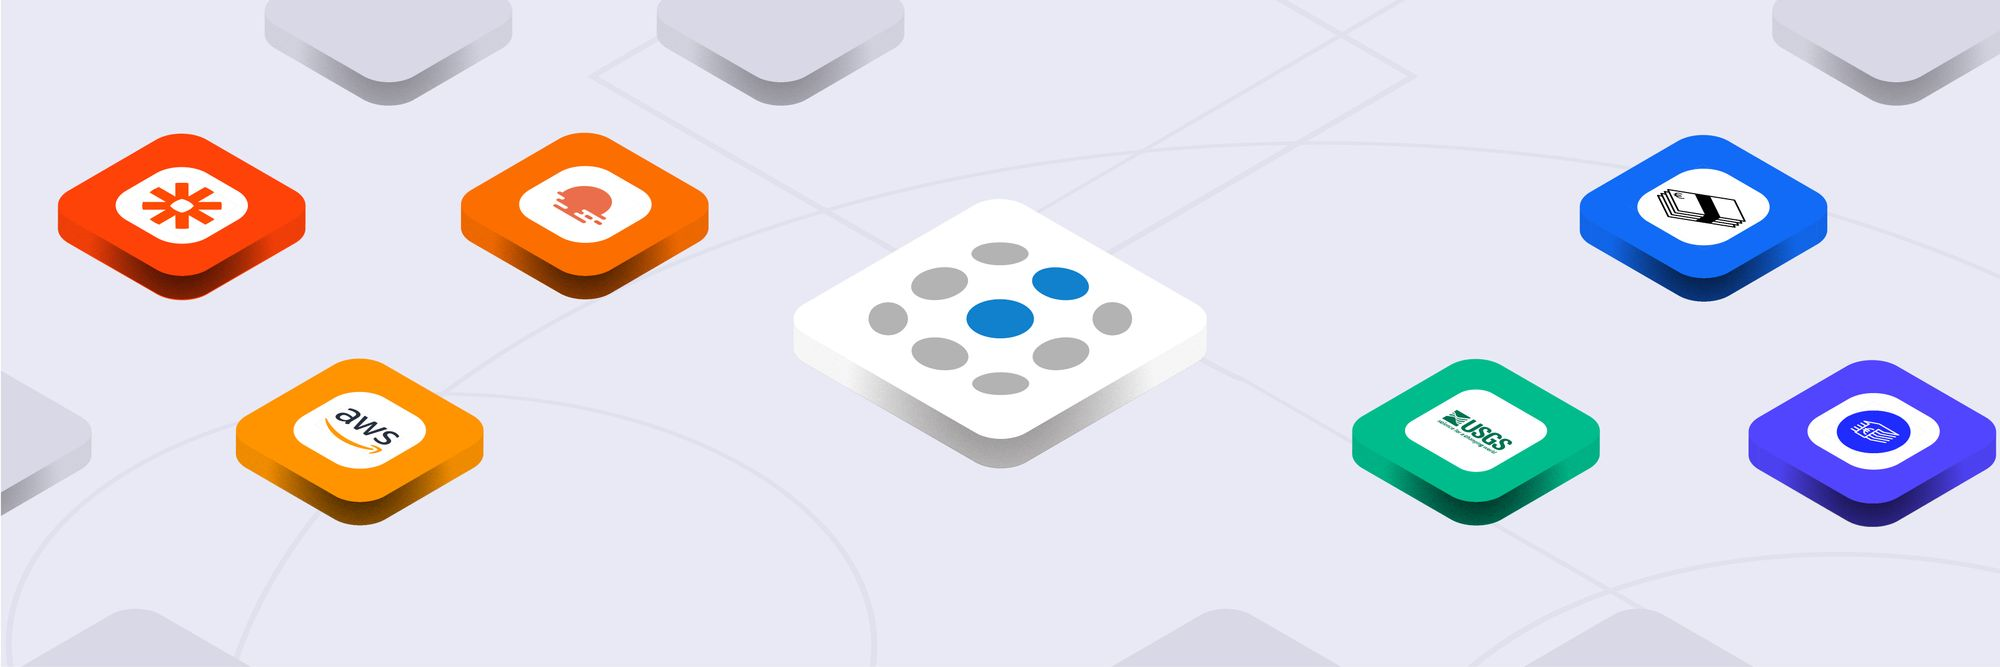
AWS IoT: Stream data from your AWS IoT Devices to Ubidots.
OpenWeather: Weather conditions for a user-defined location, with data from over 200,000 cities.
USGS WaterWatch service: A U.S. Geological Survey (USGS) service with current water streamflow conditions in the United States. This plugin will create a device with real-time streamflow conditions from the specified site number.
Fixer: Retrieves user-defined exchange rates from Fixer, using your own Fixer API Access Key.
Daily Exchange Rates: A free Exchange Rates API for current and historical foreign exchange rates published by the European Central Bank.
Please note that plugins are currently only available to Admin users; your App's end users won't see the "Plugins" option in the Devices menu.
🗳 Export your devices to a CSV file, each with its own Device Token
Device Types: Export your devices to a CSV file, each with its own Device Token plus an improved UI.
After releasing Device tokens, it became important to be able to export the device tokens in a CSV file. Imagine you need to assemble 500 new smart buttons for a food supply company, each one to be delivered to a different restaurant so they can place orders at the push of a button. After configuring these devices in Bulk, you might need to send the Device Type information to the device manufacturing team:
- Restaurant Name: To be printed in the enclosure.
- Restaurant Address: To be printed in the device enclosure.
- Device Label: To be printed in the enclosure as "Device ID".
- Device Token: To be coded in the Device firmware.
Here's a graphical representation of how this would look like:
Having a CSV file with your Device Type information will allow you to easily share it with 3rd parties, such as your electronic assembly provider.
To support this, we also had to refactor the UI of the Device Types, so we now have a place to list all of the Devices pertaining to a Type, as well as a simple way to set a type to a Device by clicking on the "+" icon in the upper right corner:
👮🏻♂️ Token permissions using organizational API Roles
API Tokens aren't just used to send data from devices; they also serve as keys to create, read, edit or delete resources within your IoT Application. Use Organizational API Roles, to create custom permissions, such as providing read-only access to your data.
The new drawer, found under "My profile" --> "API Credentials", allows you to easily set permissions to each Organization's entity
☑️ Improving our Node-RED library
Now included in several Industrial IoT gateways, Node-RED is a great tool to quickly plug devices into the Internet of Things.
Averaging 200 installs per month, our official Node-RED deserved a bit of love. We re-wrote most of its code, improving reliability and speed. Check out the library here.
⚙️ Improved TCP/UDP Ingestion
We had been working on a more efficient and reliable way to ingest device data through TCP and UDP. We're now live with a completely renewed TCP/UDP.
Curious on how to send data using these protocols? Check out the resources below.
📊 New dashboard features
Custom device names in dropdown list, "Explore data" option, and more.
Explore data option in Widgets
Quickly jump to the underlying variable(s) of a widget with the new "Explore data" option. Just click on the widget options, then "Explore data", then select a variable:
Custom device names in Devices dropdown
You can now customize the list of the devices in a dynamic dashboard. Previously, only device names were supported. Now, you can also use:
- Device name
- Device label
- Device description
This option can be found in the "Settings" drawer of a dynamic Dashboard:
Custom device list in Devices dropdown
Limit the devices displayed in a dynamic dashboard's device list. Previously, all devices were listed by default, which made sense for end-users since only devices belonging to their organization(s) were listed. However, it became important to have the ability to narrow down the list even more, so you can now select from any of these options:
- List all devices
- List only a device type
- List only a device group
This option can be found in the "Settings" drawer of a dynamic Dashboard:
🍿 Advanced device filters in devices view
Prior to this feature, it was only possible to filter devices by Organizations in the device list. You can now filter devices based on:
- Name
- Description
- API label
- Create date
- Organization
🔑 Device Tokens: secure your deployments at scale
When growing from hundreds to thousands of devices, it becomes paramount to think about security at scale. While using your account's token is great for quick prototypes and Proof of Concepts, using it across all of your customers would be as insecure as having the same password for all of your online services (email, social media, banking, etc.).
Ubidots' Organizational tokens already provide a first layer of security by allowing you to create tokens for specific sets of devices, segmented by projects, business units or customers. The next step towards safer deployments was then to create an individual token per device.
Device tokens are now generally available to all IoT Entrepreneur plans and above. We look forward to hearing your feedback and use cases in our community and support channels.
👥Manage End Users as an End User
As your device fleet grows, you'll eventually find yourself (or someone on your team) dealing with several customer requests, such as provisioning new users every week or so. With the feature "Manage Users as an End User" we've added a new set of permissions so you can entrust this task to your customers, and get back to focusing on growing your IoT Business
Kepware and Ubidots integration
Given the increasing number of industrial IoT customers, it only made sense to partner up with global leaders in the shop-floor automation space.
Kepware’s flagship product, KEPServerEX, is the industry’s leading connectivity platform that leverages OPC and IT-centric communication protocols to provide a single source of industrial automation data to all of your applications.
PTC - Kepware and Ubidots partnership enables System Integrators and IIoT adopters alike to utilize Ubidots low-code development tools as a cloud complement to traditional, on-premise MES / SCADA systems.
In the guide below, you'll learn how to connect process line variables (or "tags") captured in KEPServerEX, and relay the data over to Ubidots' cloud using an HTTP connector.
🚀API v2 is here!
Our new API is live! And so is this new documentation portal.
Ubidots API V2
API v2 is a major leap towards giving you, IoT developers, more control over your deployment. Not only have we added programmatic access to more entities, we've also included some cool features and endpoints to streamline your IoT development:
- Advanced Filtering and Sorting: Filter devices (and other entities) by name, description, tags, label, create date, properties, and more. Use the "sort_by" parameter to change the order of the response.
- Bulk Operations: Async operations allow for the creation or update of thousands of entities, without having to wait for a response.
- Device Provisioning: An exclusive endpoint to create devices and variables with user-defined names, font-awesome-compatible icons, colors, and units — in just a single API request.
- Dynamic Fields Response: Interested in just a few attributes? Cut through the noise by querying only the specified fields in every API response.
- API-first Development: CRUD operations for Devices, Variables, Organizations, DeviceGroups, Device Types, and Dashboards. More entities to come.
🔔 Repeating Events
If machines could talk, they would probably want to repeat some of their alerts, just to make sure we heard. With the latest changes in our Events Engine, you can trigger repeating actions and notifications (SMS, Emails, Voice calls, Telegrams, etc.) while event conditions are still met.
2019 Feature Recap
As a product-led company, our internal measure for growth isn't just revenue or connected devices, but mainly: What did we actually ship? Here's a quick recap of the main features we shipped this year.
? Analytics Engine
Tools to analyze historical data, trends, anomalies, and correlations across variables in your IoT Application:
- Advanced synthetic variables
? User Management
Increased security through admin users. Invite end-users to your application without sharing credentials, using Magic Links:
- Apps
? Customization
Tools to make your IoT Application unique:
- Custom styles for your dashboards and widgets
- Interact with your account from HTML widgets
? Integrations
Seamless integrations with the IoT technologies you already use:
- Improved, Mesh-compatible Particle Library
? And more widgets
New ways to display your data:
- Image
🖼️ A picture is worth a thousand dots
Ubidots widgets are off the charts ?. This month, we're announcing two more options to power your IoT Application.
Image widget
Use image widget to show the actual environment around your connected-objects, explain a concept, or simply inspire your users with the power of a picture. Learn more.
Manual Input widget
Send data points to a variable from the comfort of your dashboard. Yes, you can also set context keys and device properties ?